CNCF OpenTelemetry Elastic APM Interworking
All the application code here is available from the docs git repository.
This example builds on the passthrough CNCF OpenTelemetry configuration but configures Elastic APM as an exporter in the OpenTelemetry Collector.
It shows how Elastic APM can be used with OpenTelemetry based services directly, or via tremor for specialized processing.
- The Elastic Suite including search, Kibana and the APM server
- CNCF OpenTelemetry Onramp and Offramp deployed into tremor
- Deployment configuration file
External OpenTelemetry clients can use port 4316 to send OpenTelemetry logs, traces and metrics
through tremor. Tremor prints the json mapping to standard out and forwards the events to the
OpenTelemetry collector downstream - which is an instance of the Elastic APM Server in this case.
Environment
The onramp we use is the otel CNCF OpenTelemetry onramp listening on a non-standard CNCF OpenTelemetry port 4316, it receives protocol buffer messages over gRPC on this port. The log, metric and trace events received are converted to tremor's value system and passed through a passthrough pipeline to the CNCF OpenTelemetry sink. The sink will try to connect to a the elastic apm-server at TCP port 8200.
onramp:
  - id: otlp
    type: otel # Use the OpenTelemetry gRPC listener source
    codec: json # Json is the only supported value
    config:
      port: 4316 # The TCP port to listen on
      host: "0.0.0.0" # The IP address to bind on ( all interfaces in this case )
offramp:
  - id: otlp
    type: otel # Use the OpenTelemetry gRPC client
    codec: json # Json is the only supported value
    config:
      port: 8200 # The TCP port to distributed to
      host: "apm-server" # The Elastic APM server we're distributing to
It connects to a passthrough pipeline. This pipeline forwards any received observability events downstream unchanged.
We connect the passthrough output events into a standard output sink. The binding expresses these relations and gives deployment connectivity graph.
binding:
  - id: example
    links:
      '/onramp/otlp/{instance}/out':
       - '/pipeline/example/{instance}/in'
      '/pipeline/example/{instance}/out':
       - '/offramp/stdout/{instance}/in'
       - '/offramp/otlp/{instance}/in'
Finally the mapping instanciates the binding with the given name and instance variable to activate the elements of the binding.
mapping:
  /binding/example/passthrough:
    instance: "passthrough"
Business Logic
select event from in into out
Command line testing during logic development
Use any compliant OpenTelemetry instrumented application and configure the
server to our source on port 4316 instead of the default 4317.
Docker
For convenience, use the provided docker-compose.yaml to start and stop tremor and the OpenTelemetry collector as follows:
# Start
$ docker compose up

# Stop
$ docker compose down
Post-installation steps
Once the environment is running we can log into kibana and select the APM service from the menu system.
Using any OpenTelemetry client, send metrics or traces ( not logs as Elastic APM does not support log shipping yet ) to tremor on its OpenTelemetry port. We should see them log to console.
Console output from docker:
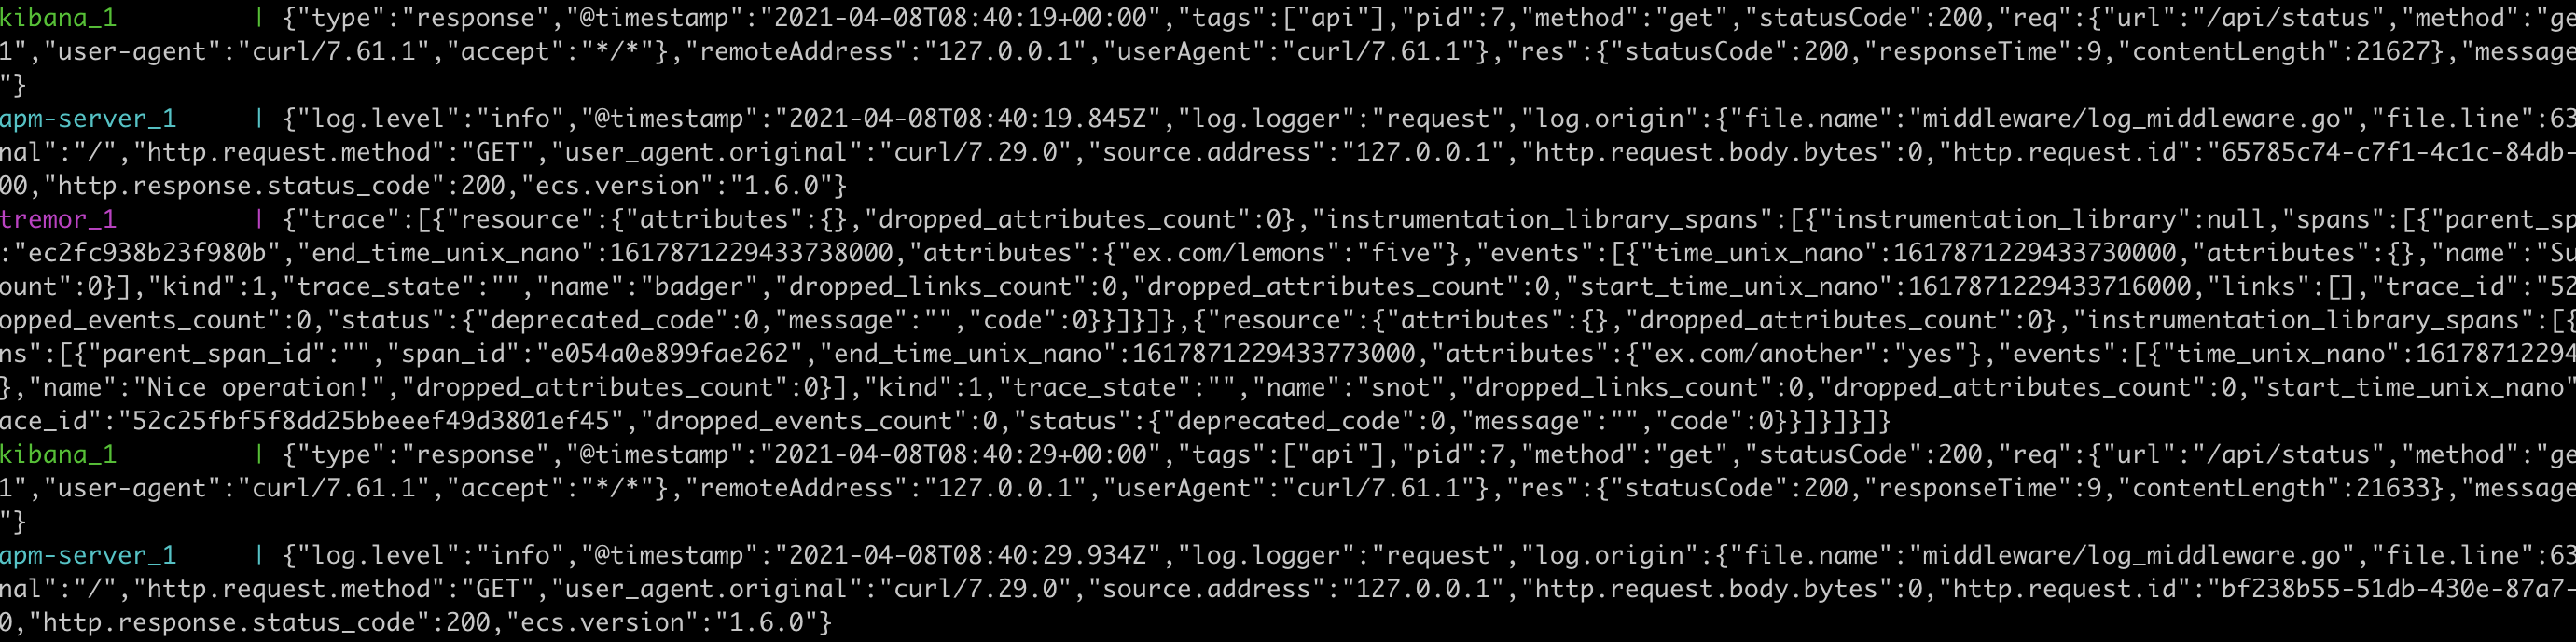
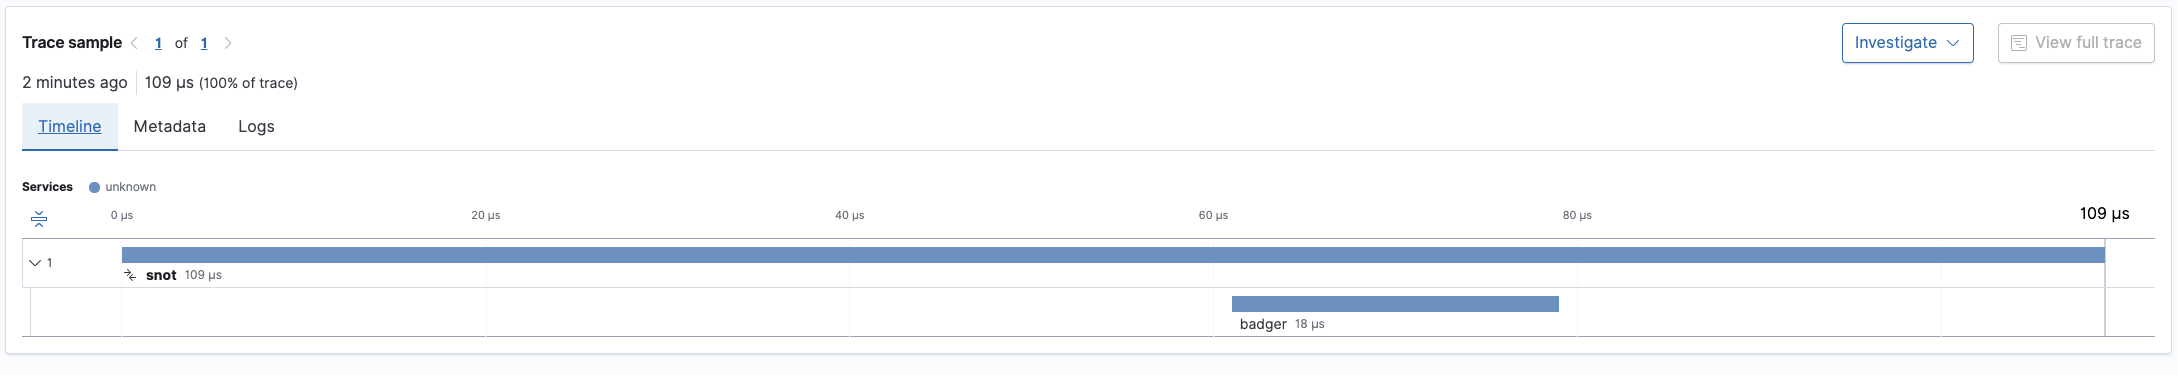
We should also be able to see metrics and spans in the APM service section of elastic.
Advanced
From here on you can configure the ElasticSearch offramp in tremor for log shipping to elastic whilst exposing a pure OpenTelemetry interface to the outside world.
This would allow upstream clients to use the OpenTelemetry protocol exclusively. A tremor algorithm can batch and convert OpenTelemetry log formatted messages to the form that the ElasticSearch APIs prefer for bulk log shipping.