CNCF OpenTelemetry Prometheus Interworking
All the application code here is available from the docs git repository.
This example builds on the passthrough CNCF OpenTelemetry configuration but configures Prometheus as a receiver and exporter in the OpenTelemetry Collector.
It shows how legacy observability frameworks such as Prometheus can be ingested into OpenTelemetry based services directly, or via the OpenTelemetry collector into tremor for specialized processing.
- Prometheus service and the Prometheus Push Gateway
- CNCF OpenTelemetry Collector service
- CNCF OpenTelemetry Onramp deployed into tremor
- Deployment configuration file
External OpenTelemetry clients can use port 4316 to send OpenTelemetry logs, traces and metrics
through tremor. Tremor prints the json mapping to standard out and forwards the events to the
OpenTelemetry collector.
Environment
The onramp we use is the otel CNCF OpenTelemetry onramp listening on a non-standard CNCF OpenTelemetry port 4316, it receives protocol buffer messages over gRPC on this port. The log, metric and trace events received are converted to tremor's value system and passed through a passthrough pipeline to the CNCF OpenTelemetry sink. The sink will try to connect to a downstream CNCF OpenTelemetry endpoint. In this workshop we will use the well known OpenTelemetry port of 4317 for our sink and run the standard OpenTelemetry collector on this port using its a collector configuration.
onramp:
  - id: otlp
    type: otel # Use the OpenTelemetry gRPC listener source
    codec: json # Json is the only supported value
    config:
      port: 4316 # The TCP port to listen on
      host: "0.0.0.0" # The IP address to bind on ( all interfaces in this case )
It connects to a passthrough pipeline. This pipeline forwards any received observability events downstream unchanged.
We connect the passthrough output events into a standard output sink. The binding expresses these relations and gives deployment connectivity graph.
binding:
  - id: example
    links:
      '/onramp/otlp/{instance}/out':
       - '/pipeline/example/{instance}/in'
      '/pipeline/example/{instance}/out':
       - '/offramp/stdout/{instance}/in'
Finally the mapping instanciates the binding with the given name and instance variable to activate the elements of the binding.
mapping:
  /binding/example/passthrough:
    instance: "passthrough"
Business Logic
select event from in into out
Command line testing during logic development
Use any compliant OpenTelemetry instrumented application and configure the
server to our source on port 4316 instead of the default 4317.
Docker
For convenience, use the provided docker-compose.yaml to start and stop tremor and the OpenTelemetry collector as follows:
# Start
$ docker compose up

# Stop
$ docker compose down
Prometheus client
We provide a prometheus client implemented in rust
use device_query::{DeviceState, Keycode};
use prometheus::{labels, register_counter};
use std::{error::Error, thread, time};

fn main() -> Result<(), Box<dyn Error>> {
    let ten_ms = time::Duration::from_millis(100);
    let johnny_five = DeviceState::new();
    let counter = register_counter!("iterations", "Number of badgers in snot green situations")?;
    let mut done = false;

    thread::sleep(time::Duration::from_secs(1)); // Delay at start in case user still has keys pressed
    println!("Press any key to stop ...");

    'main: loop {
        if done {
            println!("Done");
            break;
        }

        // Terminate if any input on stdin
        let keymap = johnny_five.query_keymap();
        for keycode in keymap {
            match keycode {
                Keycode::Right | Keycode::Left | Keycode::Up | Keycode::Down => (),
                _any_other_key => {
                    done = true;
                    continue 'main;
                }
            }
        }

        let metric_families = prometheus::gather();
        println!("Sending metrics: {}", counter.get());

        prometheus::push_metrics(
            "example_push",
            labels! {"instance".to_owned() => "HAL-9000".to_owned(),},
            "0.0.0.0:9091", // This refers to our prometheus push gateway in the docker-compose
            metric_families,
            None, // No authentication
        )?;
        counter.inc();

        thread::sleep(ten_ms);
    }

    Ok(())
}
Build and run the rust prometheus client:
$ cd prometheus-rust-client
$ cargo build
$ cargo run
Hit any non-cursor key to stop the client from injecting spans ( 10 per second ).
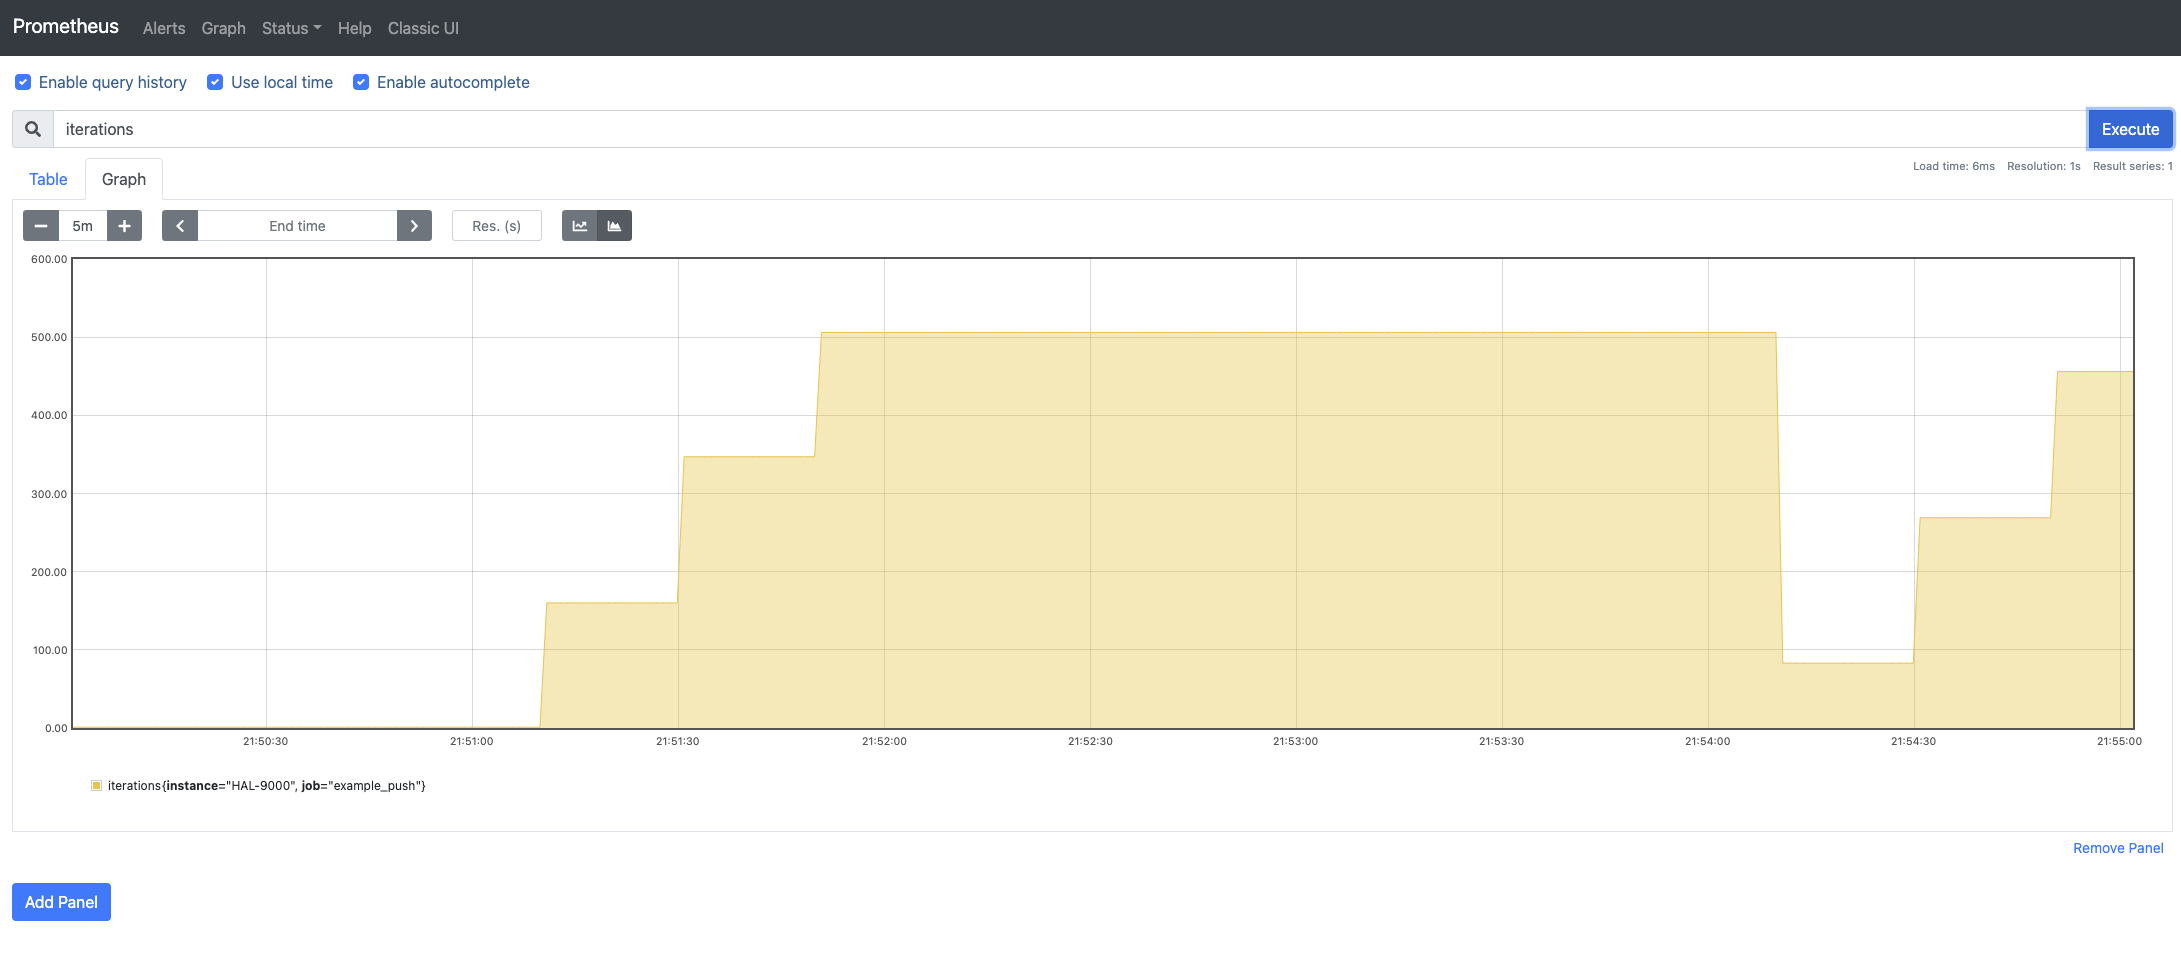
Verify our metrics reached the Prometheus UI deployed in docker via pointing our browser to http://localhost:9090 by searching for metrics:
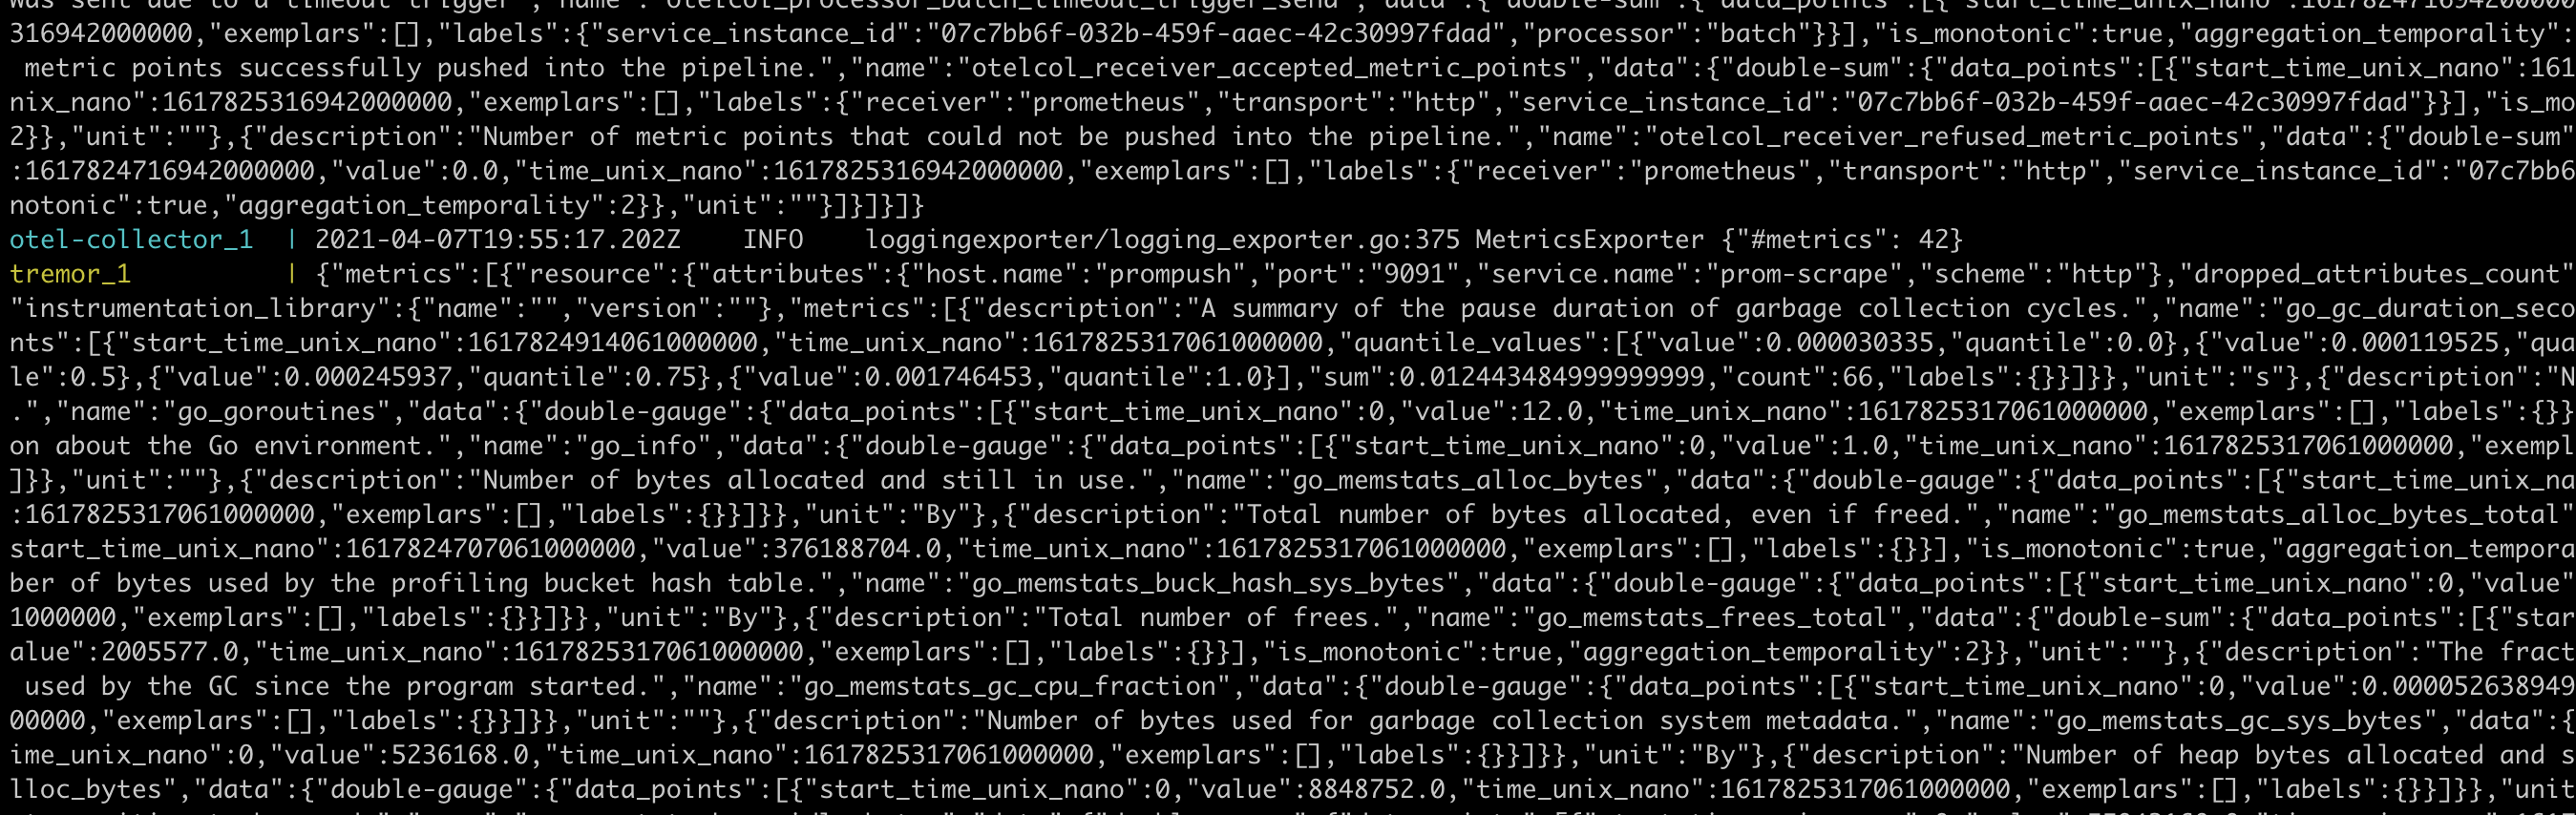
Verify that the OpenTelemetry Collector and tremor have processed our trace spans. In this configuration we use the OpenTelemetry Collector to forward to Prometheus and to forward to tremor.