CNCF OpenTelemetry Jaeger Interworking
All the application code here is available from the docs git repository.
This example builds on the passthrough CNCF OpenTelemetry configuration but configures Jaeger as a receiver and exporter in the OpenTelemetry Collector.
It shows how legacy observability frameworks such as Jaeger can be ingested into OpenTelemetry based services directly, or via the OpenTelemetry collector into tremor for specialized processing.
- Jaeger service
- CNCF OpenTelemetry Collector service
- CNCF OpenTelemetry Onramp deployed into tremor
- Deployment configuration file
External OpenTelemetry clients can use port 4316 to send OpenTelemetry logs, traces and metrics
through tremor. Tremor prints the json mapping to standard out and forwards the events to the
OpenTelemetry collector.
Environment
The onramp we use is the otel CNCF OpenTelemetry onramp listening on a non-standard CNCF OpenTelemetry port 4316, it receives protocol buffer messages over gRPC on this port. The log, metric and trace events received are converted to tremor's value system and passed through a passthrough pipeline to the CNCF OpenTelemetry sink. The sink will try to connect to a downstream CNCF
OpenTelemetry endpoint. In this workshop we will use the well known OpenTelemetry port of 4317 for our sink and run the standard OpenTelemetry collector on this port using its a collector configuration.
onramp:
  - id: otlp
    type: otel # Use the OpenTelemetry gRPC listener source
    codec: json # Json is the only supported value
    config:
      port: 4316 # The TCP port to listen on
      host: "0.0.0.0" # The IP address to bind on ( all interfaces in this case )
It connects to a passthrough pipeline. This pipeline forwards any received observability events downstream unchanged.
We connect the passthrough output events into a standard output sink. The binding expresses these relations and gives deployment connectivity graph.
binding:
  - id: example
    links:
      '/onramp/otlp/{instance}/out':
       - '/pipeline/example/{instance}/in'
      '/pipeline/example/{instance}/out':
       - '/offramp/stdout/{instance}/in'
Finally the mapping instanciates the binding with the given name and instance variable to activate the elements of the binding.
mapping:
  /binding/example/passthrough:
    instance: "passthrough"
Business Logic
select event from in into out
Command line testing during logic development
Use any compliant OpenTelemetry instrumented application and configure the
server to our source on port 4316 instead of the default 4317.
Docker
For convenience, use the provided docker-compose.yaml to start and stop tremor and the OpenTelemetry collector as follows:
# Start
$ docker compose up

# Stop
$ docker compose down
Jaeger client
We use an existing Jaeger client for demonstration purposes. Fetch the standard C++ Jaeger client as follows:
# Clone the git repo
$ git clone https://github.com/jaegertracing/jaeger-client-cpp
# Change directory into the repo root
$ cd jaeger-client-cpp
# Build ( make a cup of tea, this takes a while! )
$ mkdir build
$ cd build
$ cmake ..
$ make
Configure the example jaeger application to point at our dockerized service
disabled: false
reporter:
  logSpans: true
  endpoint: http://localhost:14268/api/traces
sampler:
  type: const
  param: 1
Run the jeager client to generate trace spans
# From the `build` directory
$ ./app ../examples/config.yml
INFO: Initializing logging reporter
INFO: Reporting span f05fbb51006ac531:f062508e8013067f:f05fbb51006ac531:1
INFO: Reporting span f05fbb51006ac531:f05fbb51006ac531:0000000000000000:1
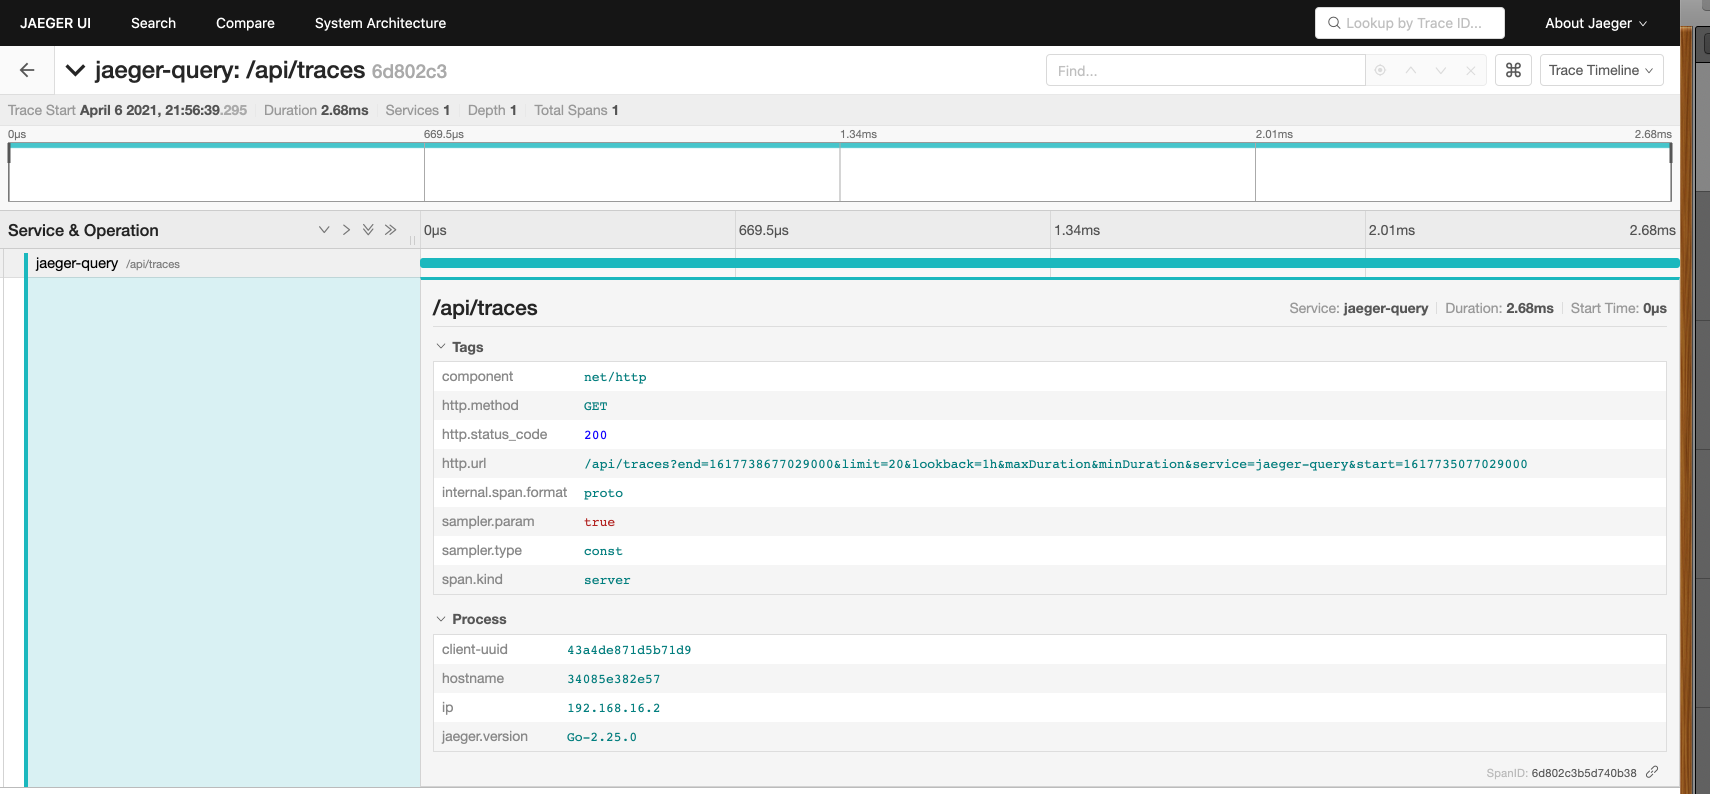
Verify our spans reached the Jaeger UI deployed in docker via pointing our browser to http://localhost:16686 by searching for traces:
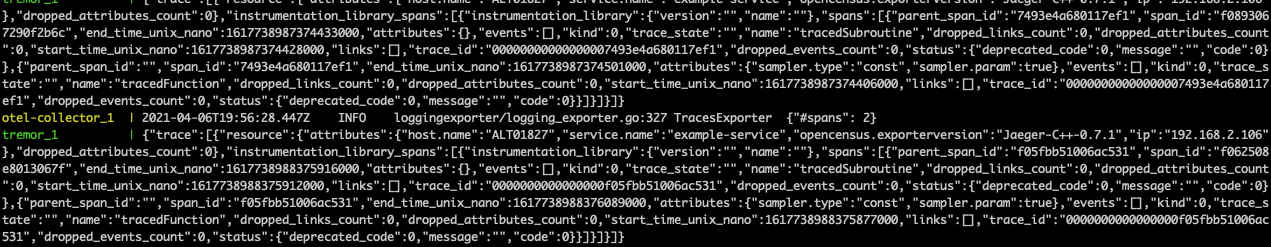
Verify that the OpenTelemetry Collector and tremor have processed our trace spans. In this configuration we use the OpenTelemetry Collector to forward to Jaeger and to forward to tremor.